
Age separation dramatically reduces COVID19 mortality ...
Research by: Dr. Shani Stern
- December 2, 2021
COVID-19 pandemic has caused a global lock down in many countries throughout the world. Faced with a new reality, and until a vaccine or efficient treatment is found, humanity must figure out ways to keep economy going on one hand, yet keep the population safe on the other hand, especially those that are susceptible to this virus. Here we use a network simulation, with parameters that were drawn from what is known about the virus, to explore 5 different scenarios of partial lock down release. We find that separating age groups by reducing interactions between age groups, protects the general population and reduces mortality rates. Furthermore, addition of new connections within the same age group to compensate for the lost connections outside the age group, still has a strong beneficial influence and reduces the total death toll by 66%. While complete isolation from society may be the most protective scenario for the elderly population, it would have an emotional and possibly cognitive impact that might outweigh its benefit. We therefore propose creating age-related social recommendations or even restrictions, thereby allowing social connections but still strong protection for the older population.
Additional Information:
https://shanistern.wixsite.com/disease-modeling/
https://www.medrxiv.org/content/10.1101/2020.05.27.20111955v1
Video Link:
Video Link
Video Legend
The video explores several scenarios of limitations on social interactions. In all possibilites (states) individuals are assumed to wear masks and keep social distancing. However, in the first state there are no other restrictions. Blue dots represent the general population, orange dots represent carrier individuals (asymptomatic), red dots represent infected individuals, and black dots are individuals who dies from COVID-19. The shape of the dots marks the age groups (a circle for ages 0-14, a triangle for 15-34, a square for 35-54 and an x for ages 55+). In state 2 we did not allow interactions between the different age groups, such that the interactions among family members remained without a change, but all other connections were eliminated. This reduced the connectivity of the network. Instead, we added in state 2 new random connections within the same age group to replace any connection that was eliminated. In state 3 we did not allow connections with the elderly group of 55+ (except if they are in the same household). Such restrictions also reduced the number of overall connections, and we therefore added random connections within the same age group to any connection that was eliminated between the age groups. In state 4 we kept all the connections, but reduced the connectivity between age groups, by reducing by half the infection rates between age groups.
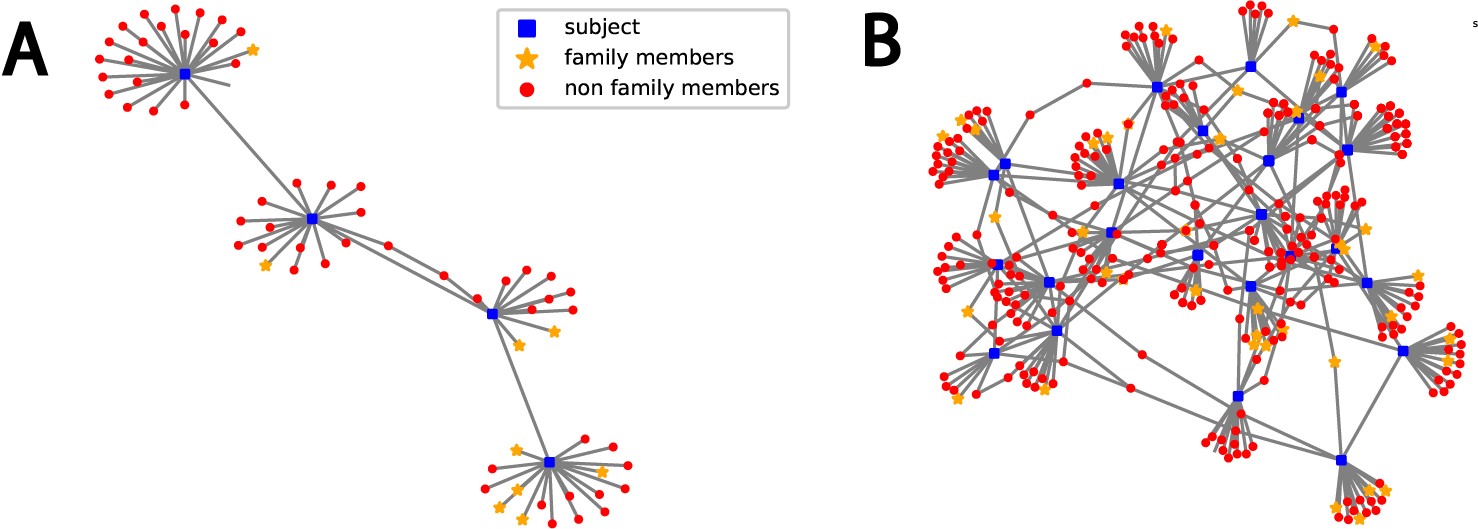
We used network theory to model a large population with an Erdős-Rényi model network with degree distribution of 15 to observe COVID-19 infection spread and mortality rate. Figure 4 in the article describes an example network with a family size of 4 ±1. An example topology is shown in these images with a network of 3 subjects on the left and with 30 subjects on the right.